

This program is designed to guide you through the core concepts, features, and functionality of the IntelligentAI indicators and models. Each indicator is covered in its own dedicated section below. To ensure a complete and structured understanding of the AIFS framework we strongly recommend watching them in sequence.
As with any advanced skill, true mastery requires commitment, consistency, and practice. These techniques cannot be learned overnight. For this reason, we provide a free 30-day trial period to help you begin your journey with confidence.
We strongly encourage all users to practice in a simulation account while learning and applying cycle theory in real market conditions. A simulated environment allows you to develop discipline, refine your execution, and build confidence—without risking real capital.
Most experienced traders should expect to spend several months refining these concepts. New traders should plan for a minimum of 4–6 months of consistent simulation before transitioning to live trading. This preparation period is essential for developing the skills, mindset, and consistency required for long-term success.
AIFS (Artificial Intelligence Forecast System) is our proprietary framework leveraging advanced deep learning techniques to create highly accurate financial models. By defying the conventional wisdom of data science 'experts' who claim trained output cannot be used to train new models, AIFS captures the underlying dynamics of price delivery through a unique and innovative approach. The framework integrates several cutting-edge components to achieve its predictive power.
AIFS uses irregular time series data with Singular Spectrum Analysis (SSA) modeling coupled with Recurrent Neural Networks (RNN) to model sequential dependencies and temporal patterns in our range data. Finally, AIFS incorporates Convolutional Neural Networks (CNN) to extract spatial and structural features to form the basis of cycle predictions. The core of our AIFS framework is the Anomaly Detection Model (ADM).
With a synergistic combination of SSA, RNN, and CNN, AIFS achieves a comprehensive understanding of market dynamics, enabling it to outperform traditional forecasting methods. This proprietary blend of techniques positions AIFS as a groundbreaking tool for financial market analysis and decision-making.
Cycle theory in financial markets is the study and analysis of recurring price patterns and trends that occur over time. These cycles are believed to reflect the underlying heart beat of market behavior, economic conditions and external factors. The theory assumes that markets do not move randomly but rather in repetitive patterns or cycles as we call them.
A range-based chart is a type of financial chart where each bar represents a specific price range rather than a fixed time interval. This approach focuses purely on price movements and ignores the time it takes for the price to move within the specified range. We use AIFS to decipher and predict the repetitive cycles on range-based charts. AIFS and the performance of our deep learning models confirm that financial markets do in fact repeat in cycles.
The definition of a cycle is when price starts at a specific value, moves up or down and returns back to the starting value. Cycles suggest that the market behavior is fractal in nature. Cycles are not confined to specific price ranges. Instead, they occur as a fundamental aspect of market behavior.
This makes the identification of these cycles more reliable for analysis, as they are not limited to a single resolution. The recurrence of cycles across range chart values reflects the fractal properties of financial markets. Patterns repeat in a self-similar way regardless of scale, aligning with concepts from chaos theory and technical analysis. In essence, cycles appearing across all range chart values highlight the universal and scalable nature of price movements, making them an essential consideration for understanding and capitalizing on market dynamics.
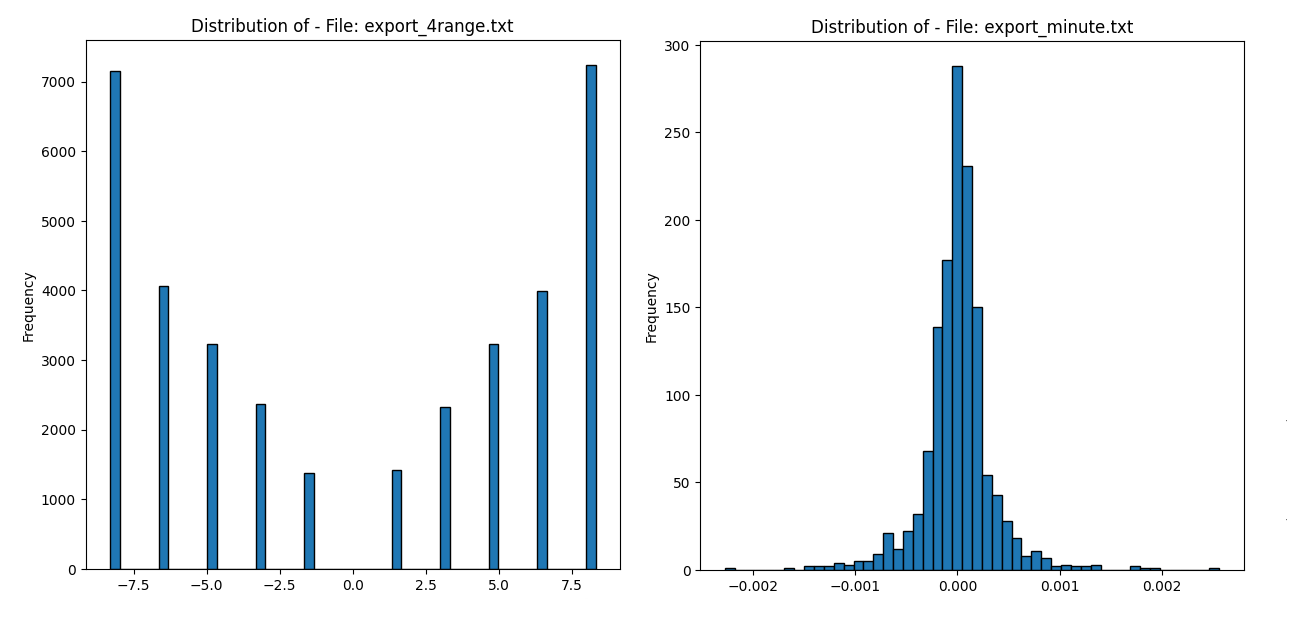
We compared the distribution of range-based financial data and time-based financial data to understand how each type segments price and the implications this has on the data's behavior, patterns, cycle development and accuracy during deep learning. The below example shows the distribution of one years worth of data taken from the same time period.
Cycles refer to the natural ebb and flow of price movements as markets transition between phases of expansion and contraction. These cycles can be bullish, bearish, or range-bound (both). Price moves between highs and lows. Cycles are self-sustaining—one cycle leads to the next, often aligned with liquidity grabs and order flow imbalances. When price trends, it moves away from equilibrium (cycle start) creating liquidity voids. In order to restore equilibrium price needs to return (cycle end) to where price started (reversion phase).
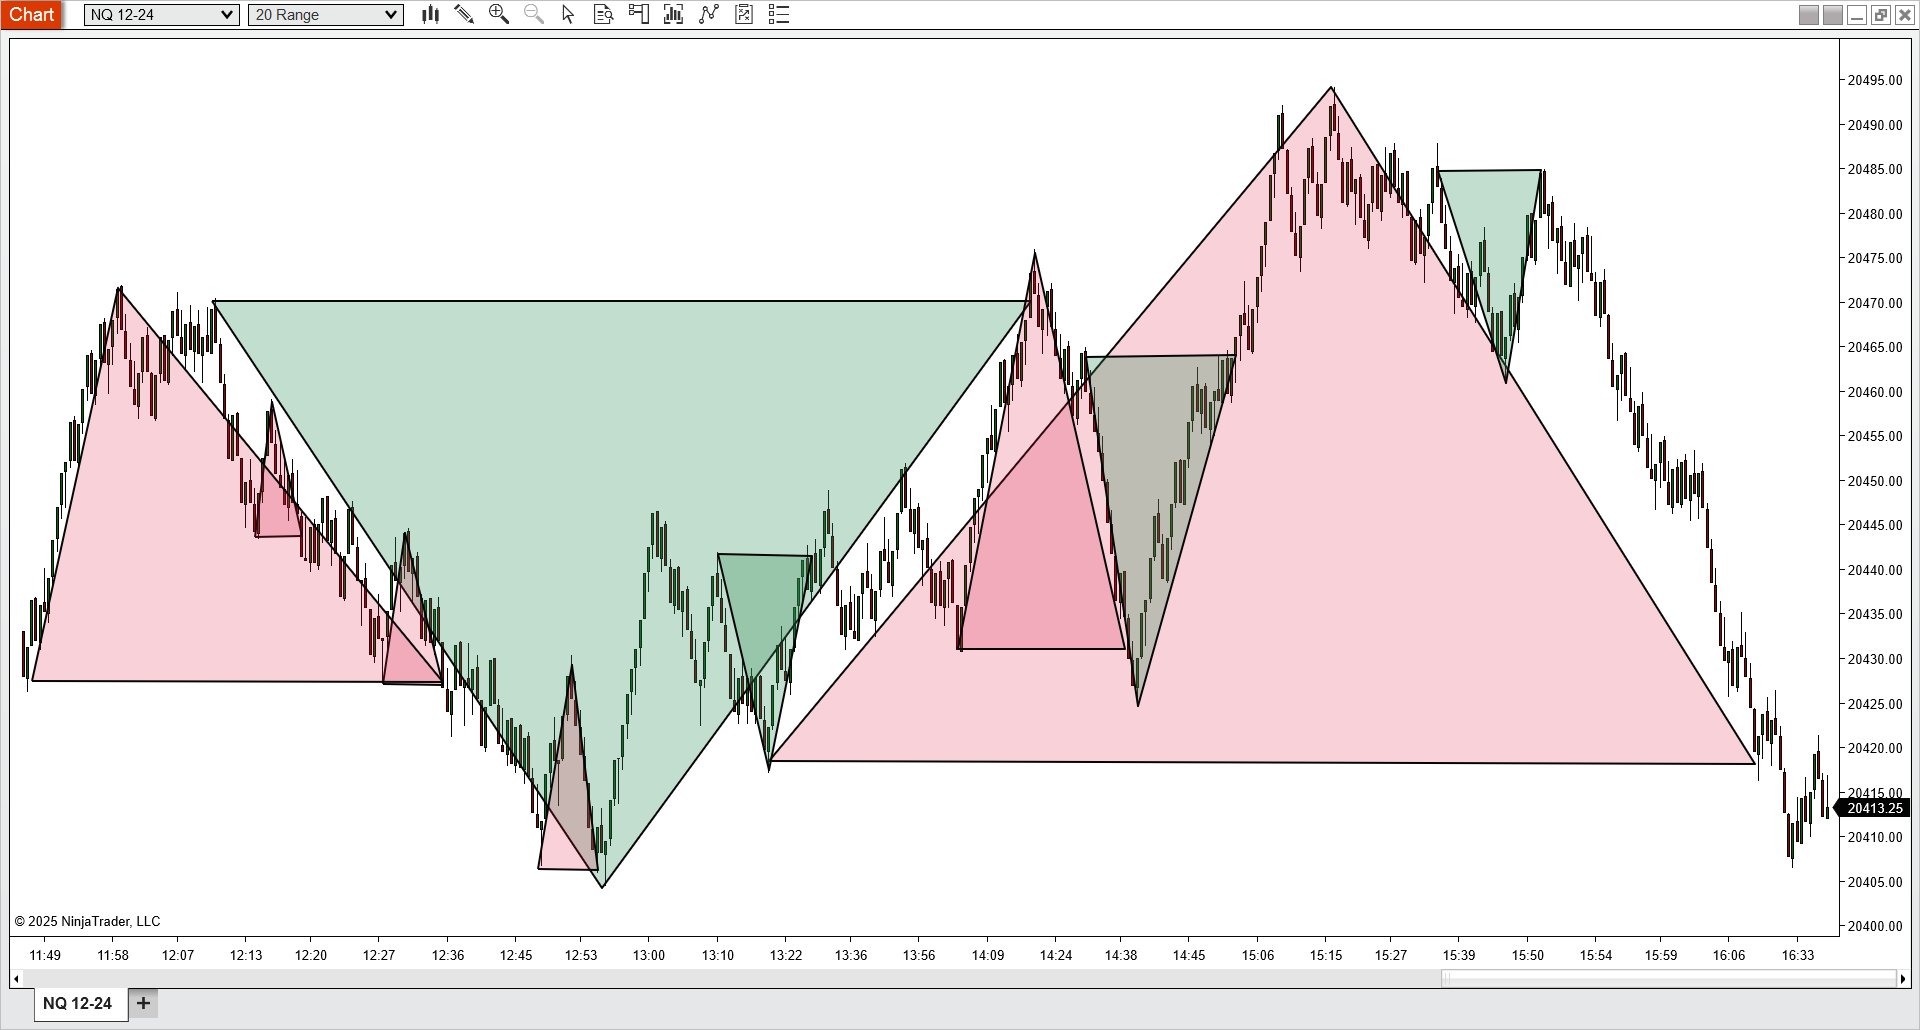
On smaller range charts, what appear to be simple pullbacks and rallies are actually smaller cycles forming and completing within a larger cycle (nested cycles). Understanding where price is within the current cycle determines whether we should be looking for a long or a short trade.
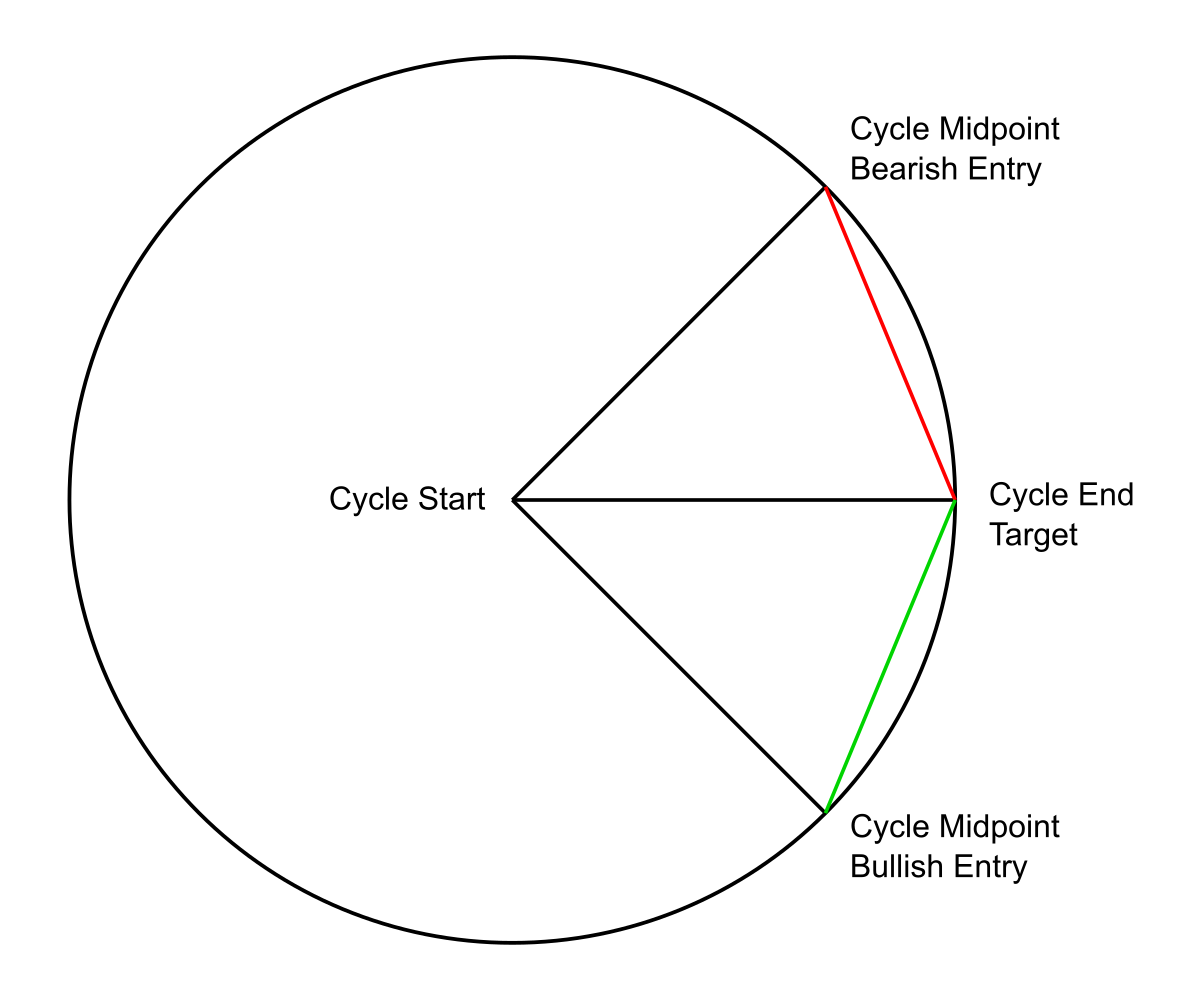
Each cycle has a clearly defined start price, and the cycle is considered complete when price returns to that same level. Because of this, the cycle’s end price is always known in advance.
If price is trading above the cycle start, we are preparing for a short trade, targeting a move back down to the cycle start. However, we do not enter immediately. We wait until the prior bullish cycle has fully completed before taking the short.
If price is trading below the cycle start, we are preparing for a long trade, targeting a move back up to the cycle start. Again, we wait until the prior bearish cycle has fully completed before entering the long.
Before taking any trade, we always look left on the chart to identify the stage of the previous cycle, as this context confirms whether a cycle has finished and a new one is valid.
The diagram below illustrates how these nested cycles form and how trades are taken by aligning entries with completed cycles rather than reacting to random price movement.
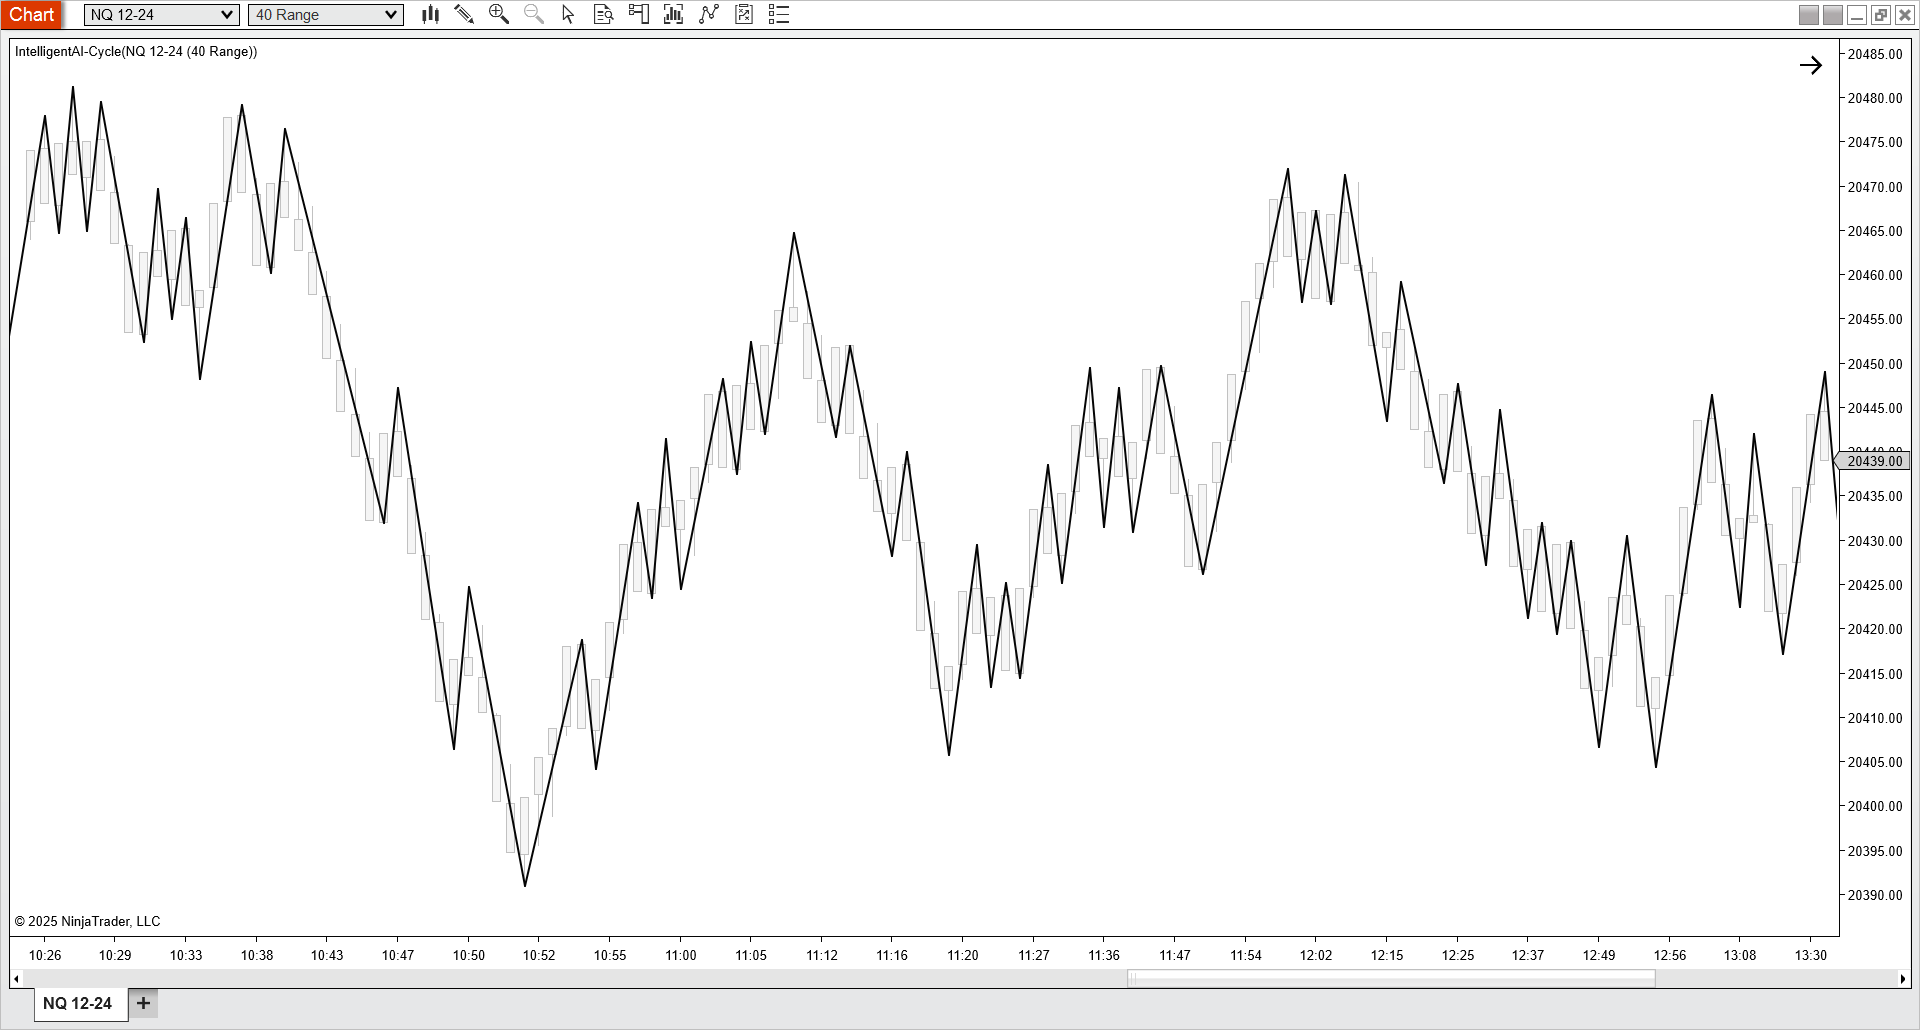
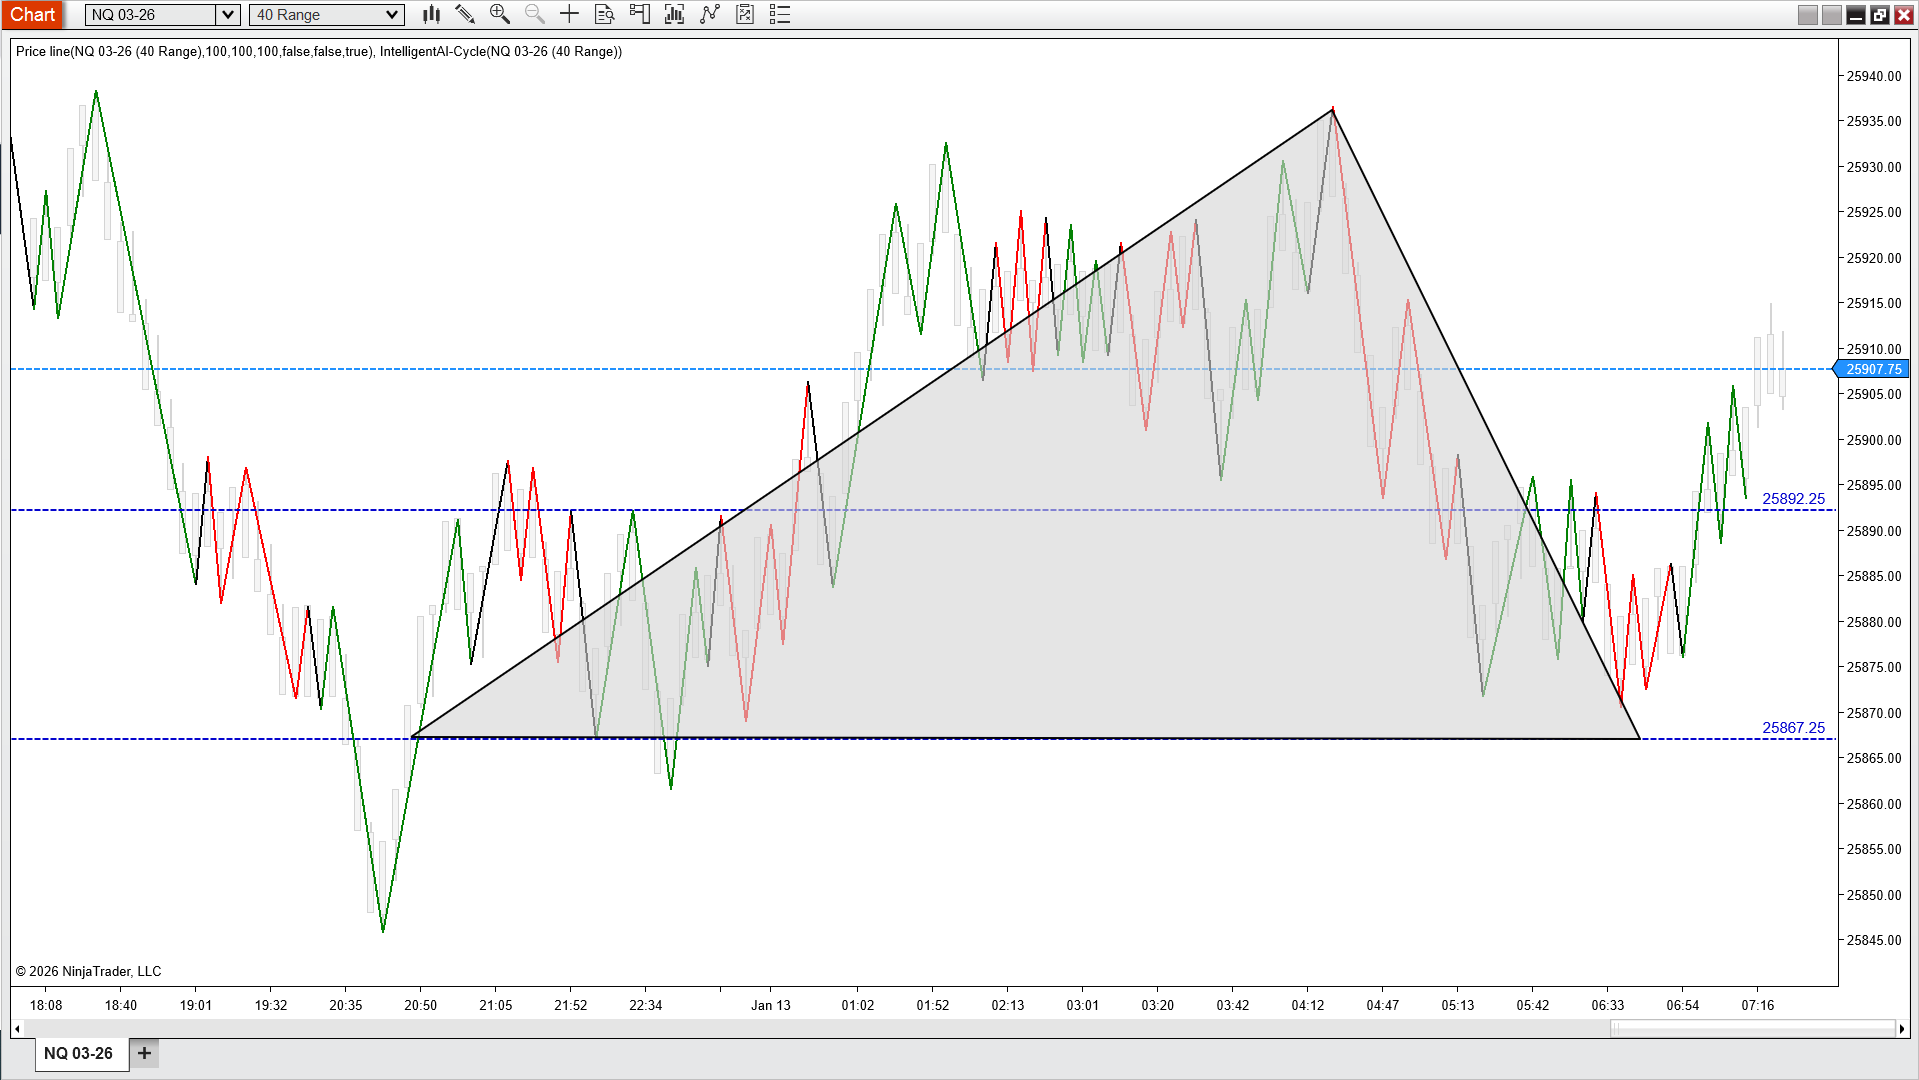
In the video below (sped up 50x), we are showing an example of smaller cycles starting and ending within a higher time frame cycle. At 9:41pm EST price starts at 25892 and completes the bearish cycle at 25867 then returns back to 25892 to complete a bullish cycle. Price continues to consolidate until a manipulation phase starts. Cycles are self-sustaining—one cycle leads to the next, often aligned with liquidity grabs and order flow imbalances. When price trends, it moves away from equilibrium (cycle start) creating liquidity voids. In order to restore equilibrium price needs to return (reversion phase) to where price started (cycle end). Almost 9 hours later price has completed the reversion phase on a higher range chart and returned to the cycle start.
Here is the chart showing the larger cycle being completed from the previous example.
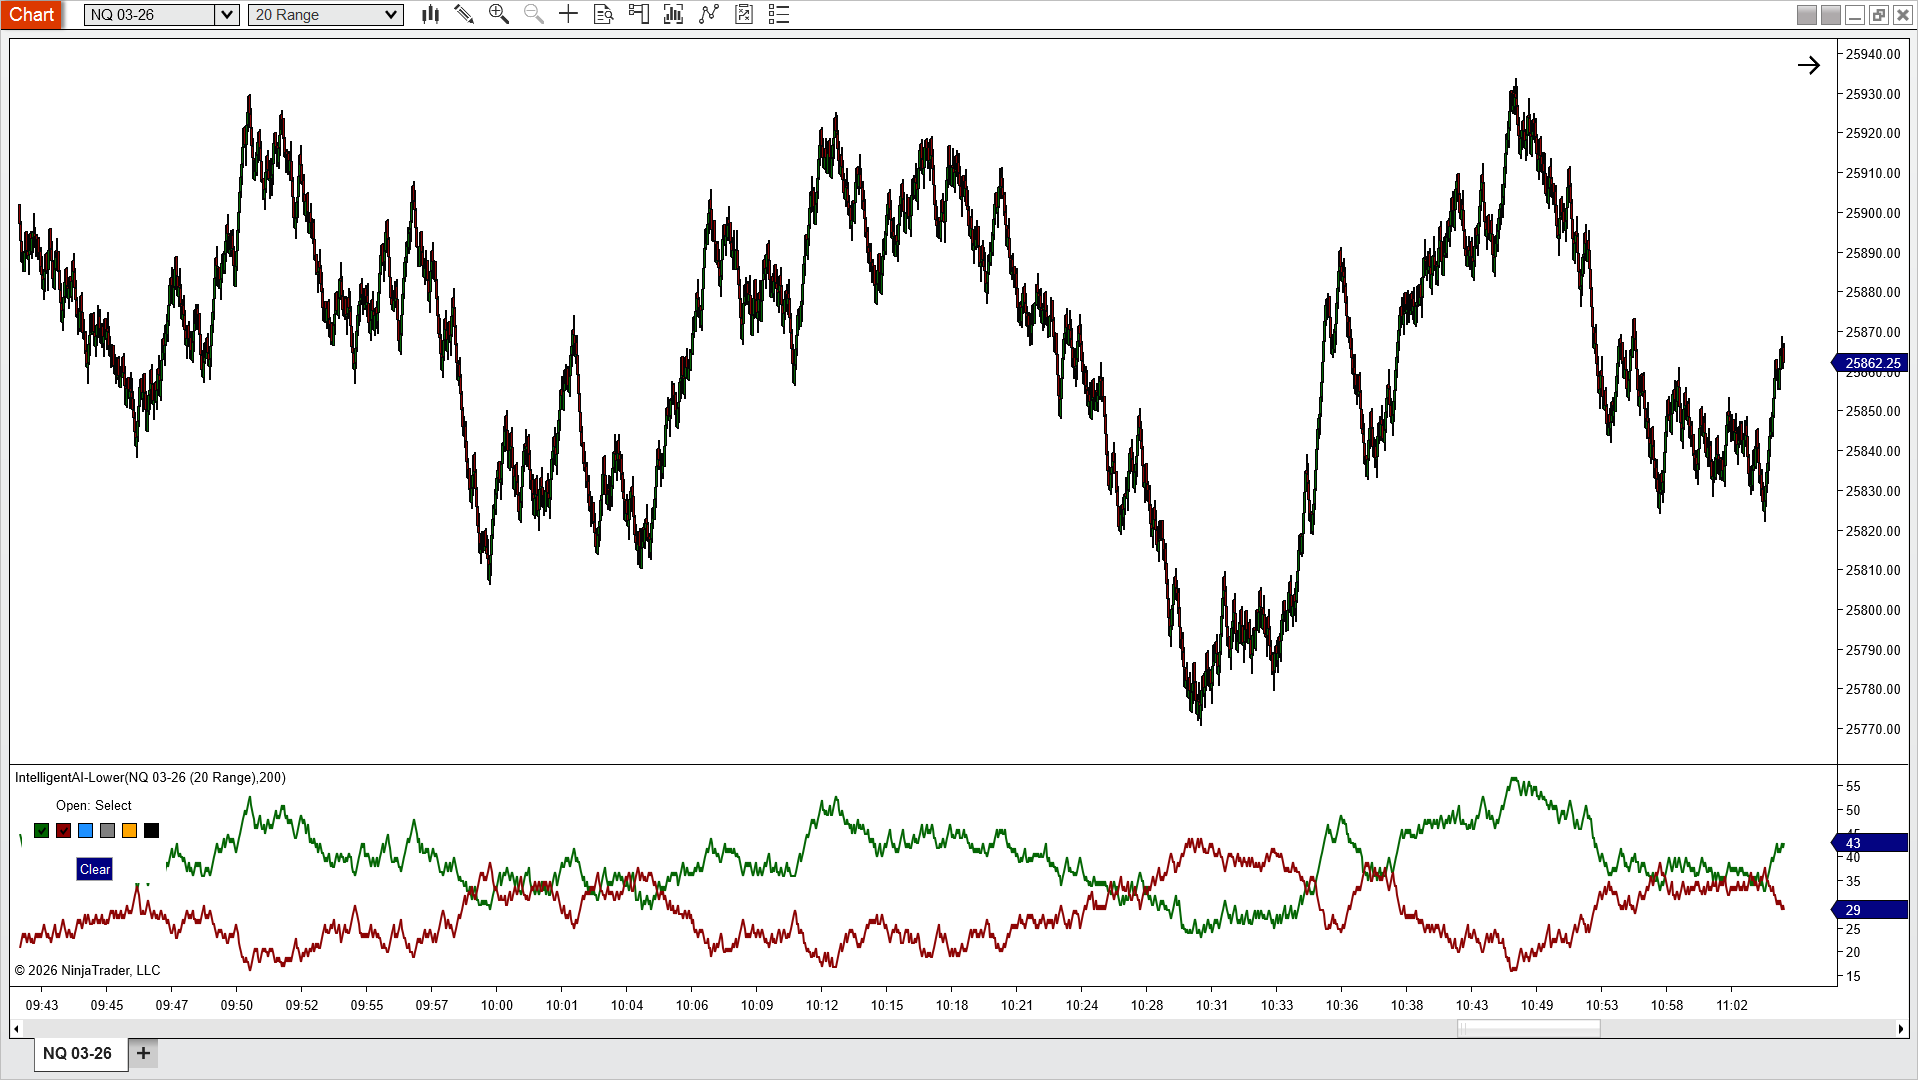
The Anomaly Detection Models (ADM) consist of two models that identify anomalies in price movements. The red plot highlights bearish anomalies, while the green plot represents bullish anomalies. The AIFS framework updates these plots in real-time as cycles start and end. Historical context is critical, as we analyze completed cycles by "looking left" on the chart. There are three key actions: bullish anomalies at zero (long entry), bearish anomalies at zero (short entry) and cross overs between the two models (long or short entry). ADM data forms the core of the AIFS framework, serving as the foundation for all our models and insights.
Usage: Three basic strategies
Observation Tip 1: When the models converge, historical observations often show price is at or near the volume weighted average price (VWAP), signaling a consumption of previous cross cycles. See this chart.
Observation Tip 2: When the bullish model crosses above the bearish model, an opportunity to go short can be considered when the bearish model gets to zero. This is typically close to the cycle midpoint as shown on Part 2: How Do We Trade Cycles. The opposite will exist for long opportunities. See this chart.
Advanced Usage Tip: Add multiple ranges to your base chart and reference IntelligentAI-Lower on each different range to see bullish or bearish MTF alignments. See Bullish chart. See Bearish chart.
For your convenience, a premade template was copied to your charts template folder. On a chart with 3 data series, right click the chart and select Templates>Load and select IAI 3 Series AI-Lower Bullish or IAI 3 Series AI-Lower Bearish. You can also combine them into one chart as desired.
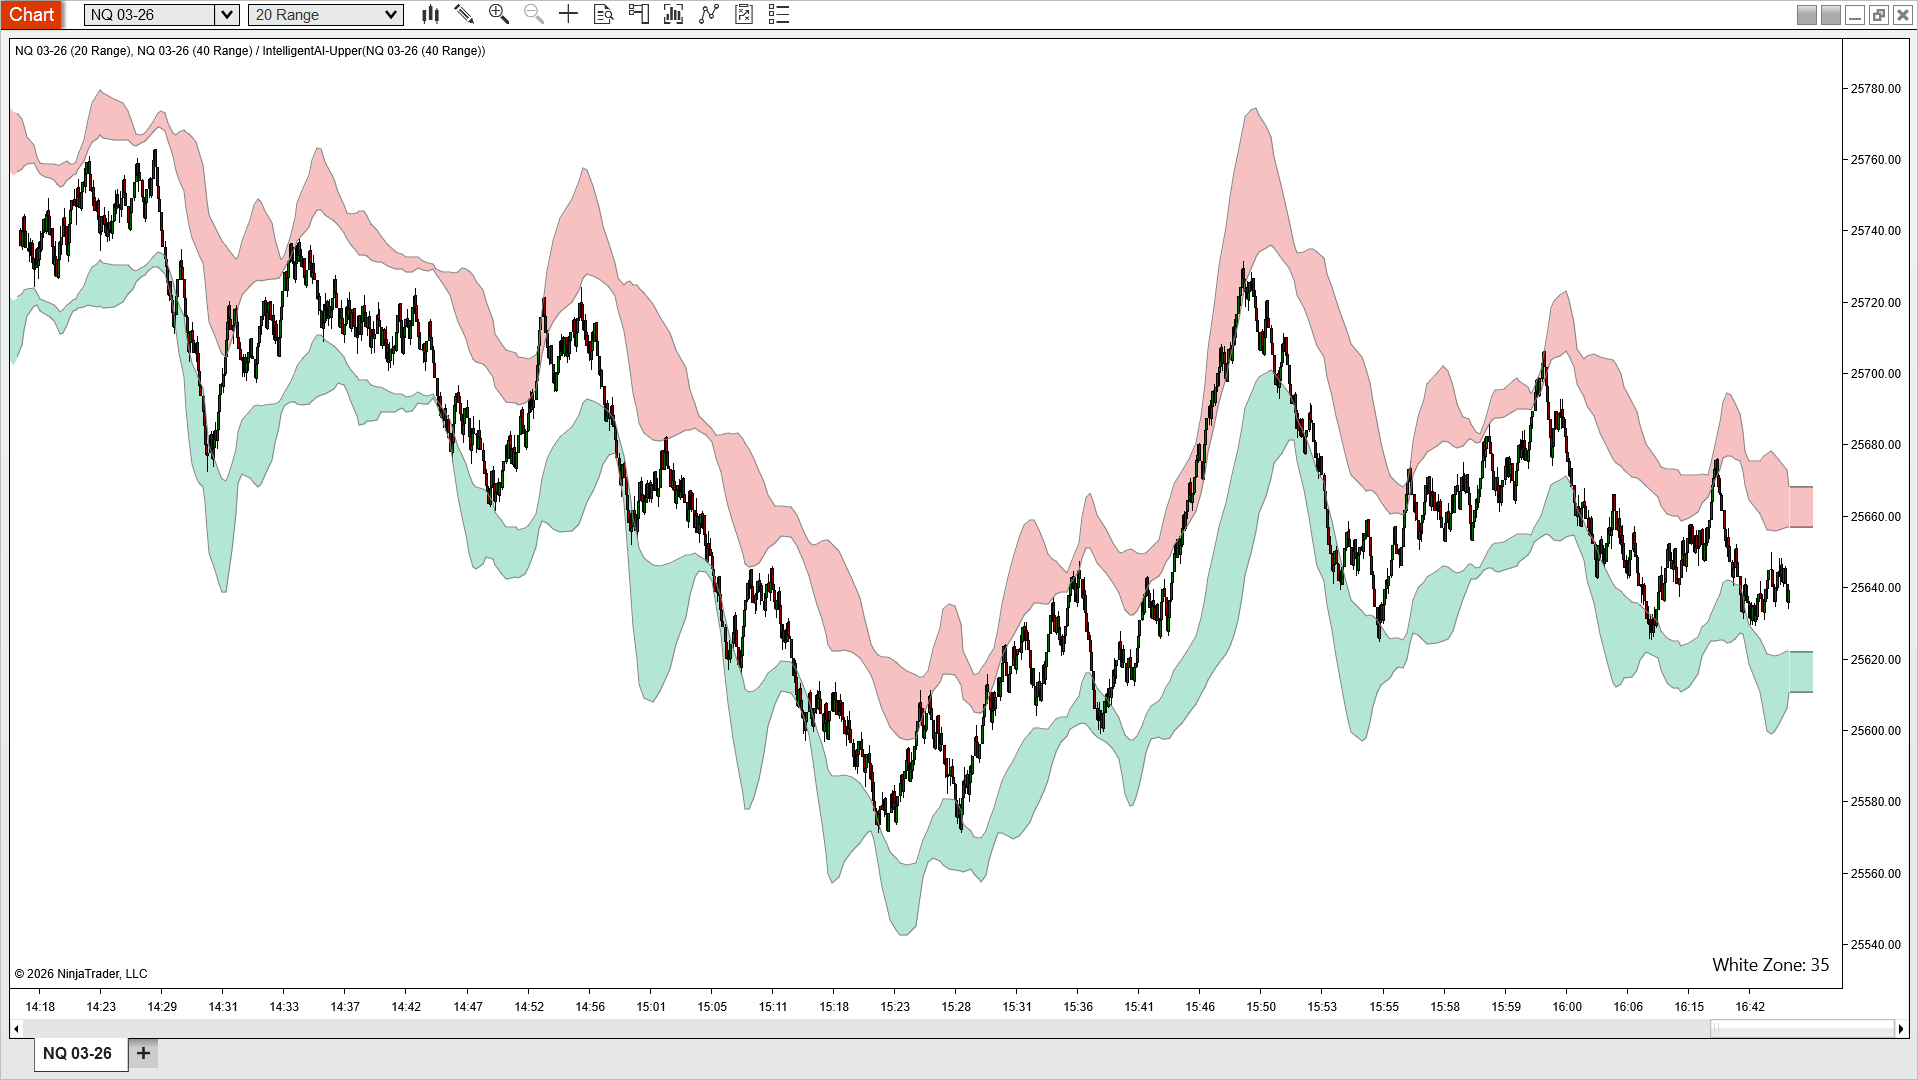
Value Zone Models (VZM) are trained using our proprietary ADM data and leverages Singular Spectrum Analysis (SSA) to extract cycles from preprocessed range data. These cycles identify whether the short-term value of an asset is trading at a premium or discount. As market cycles consolidate, price typically oscillates between the upper zone (Sell Value Zone) and the lower zone (Buy Value Zone). When an SSA anomaly cluster is detected, the value zones form a peak, signaling a potential market shift. Complementing this, the Bar Predictor Model (BPM) generates a plot of the predicted short-term directional trend. It is also available for use as a standalone indicator, IntelligentAI-BPM.
Usage: Two basic strategies
Buying and selling are in equilibrium—neither bulls nor bears dominate. This sideways consolidation often occurs after vertical moves where traders look for fair value.
Observation Tip: When price has taken out a previous SSA anomaly cluster (peak) look for a longer correction back to the last observed peak. See this chart.
Advanced Usage Tip: Add multiple ranges to your base chart and reference IntelligentAI-Upper from a higher range chart to see bullish or bearish MTF alignments. See this chart.
For your convenience, a premade template was copied to your charts template folder. On a chart with 2 data series, right click the chart and select Templates>Load and select IAI 2 Series AI-Upper.
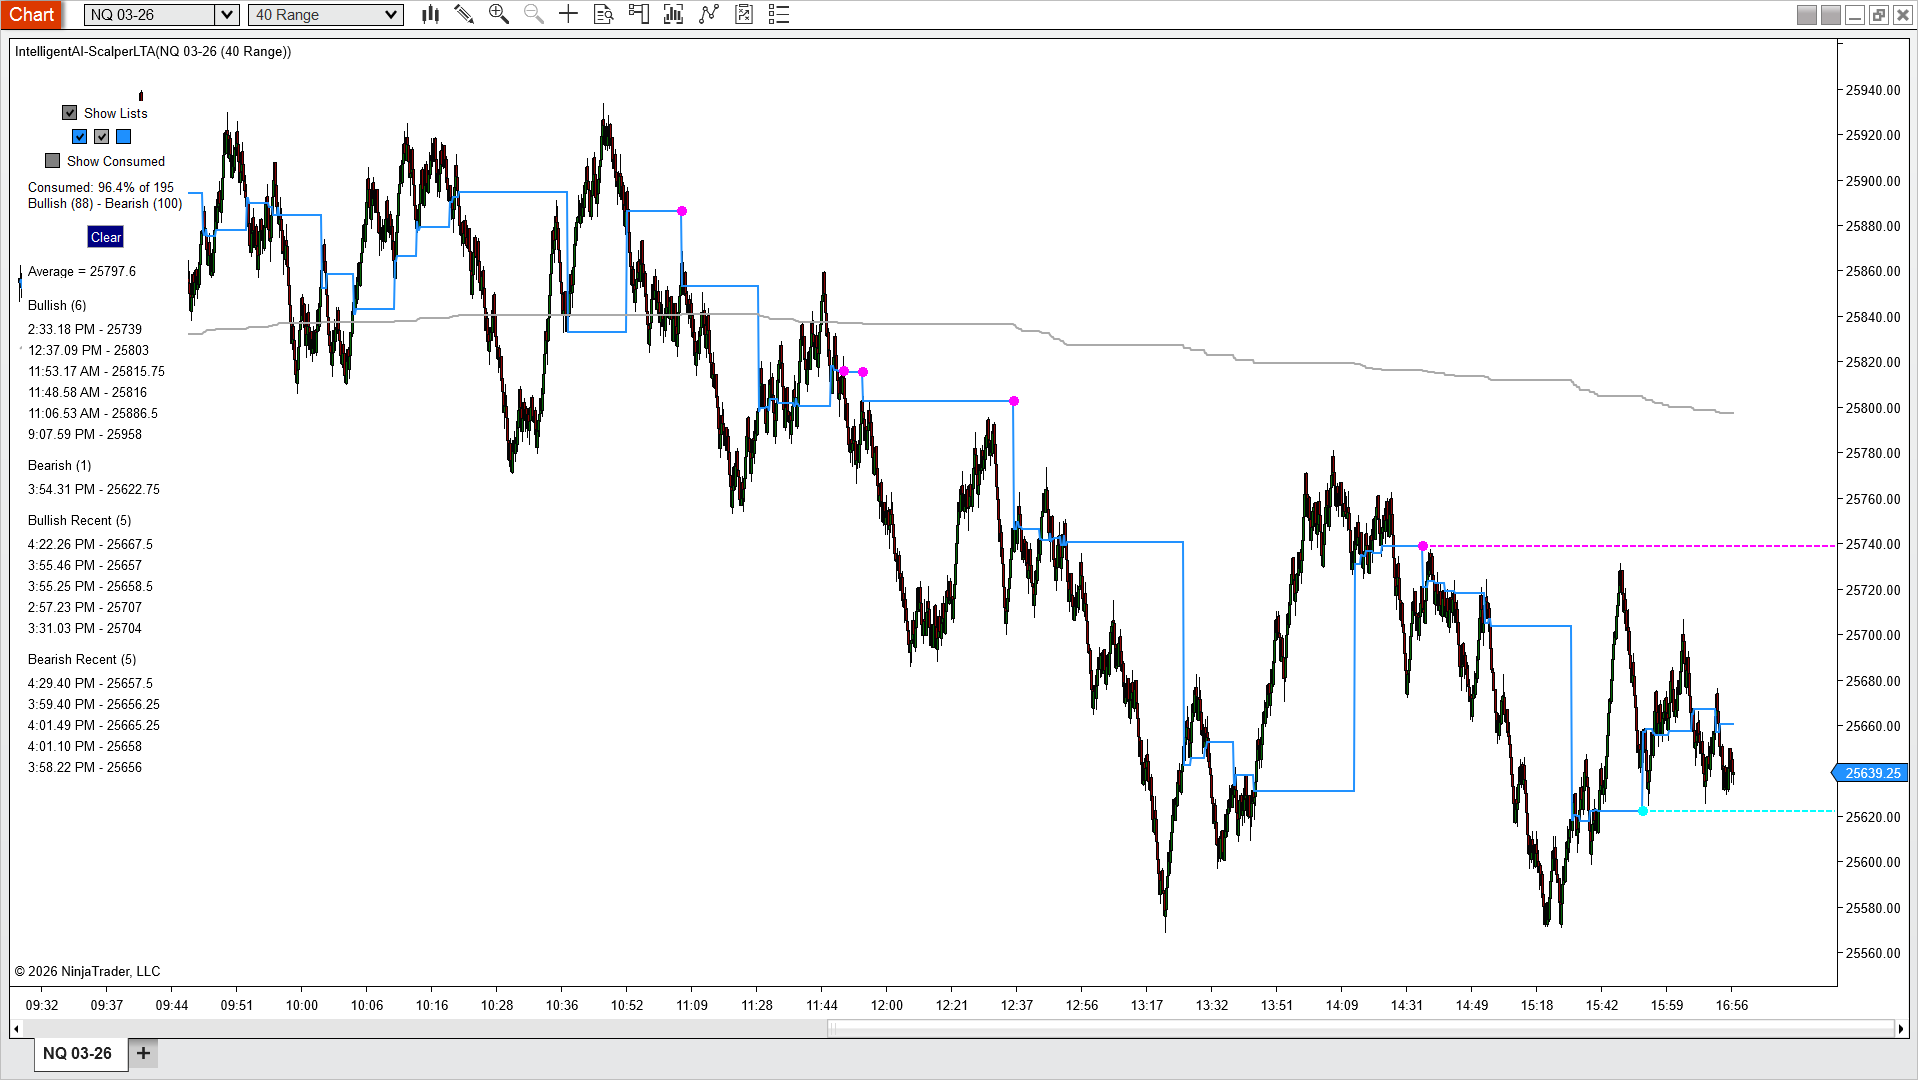
The CRMLTA model processes real-time data from the ADM, dynamically generating predictive arrays based on CRM model criteria. When the raw ADM data aligns with these conditions, a horizontal segment is added to the prediction array. With each new bar, the model continuously evaluates incoming ADM data. If a value falls outside the defined criteria, a new prediction array is initiated. The vertical segment represents the price movement required to fulfill the previous prediction. Key markers enhance visual clarity—magenta dots signal bullish predictions, cyan dots indicate bearish predictions, and the blue dot highlights the midpoint of each predicted range.
Usage: Two basic strategies
The predictions window can display consumed and unconsumed predictions. The number of predictions consumed or unconsumed is displayed next to the corresponding predictions label. By double clicking on an entry in the list, the locator line will display for a single bullish and bearish entry. Select clear to remove. Beneath the show window label is a series of check boxes to display the prediction plot, predictions average plot and the 50% average plot.
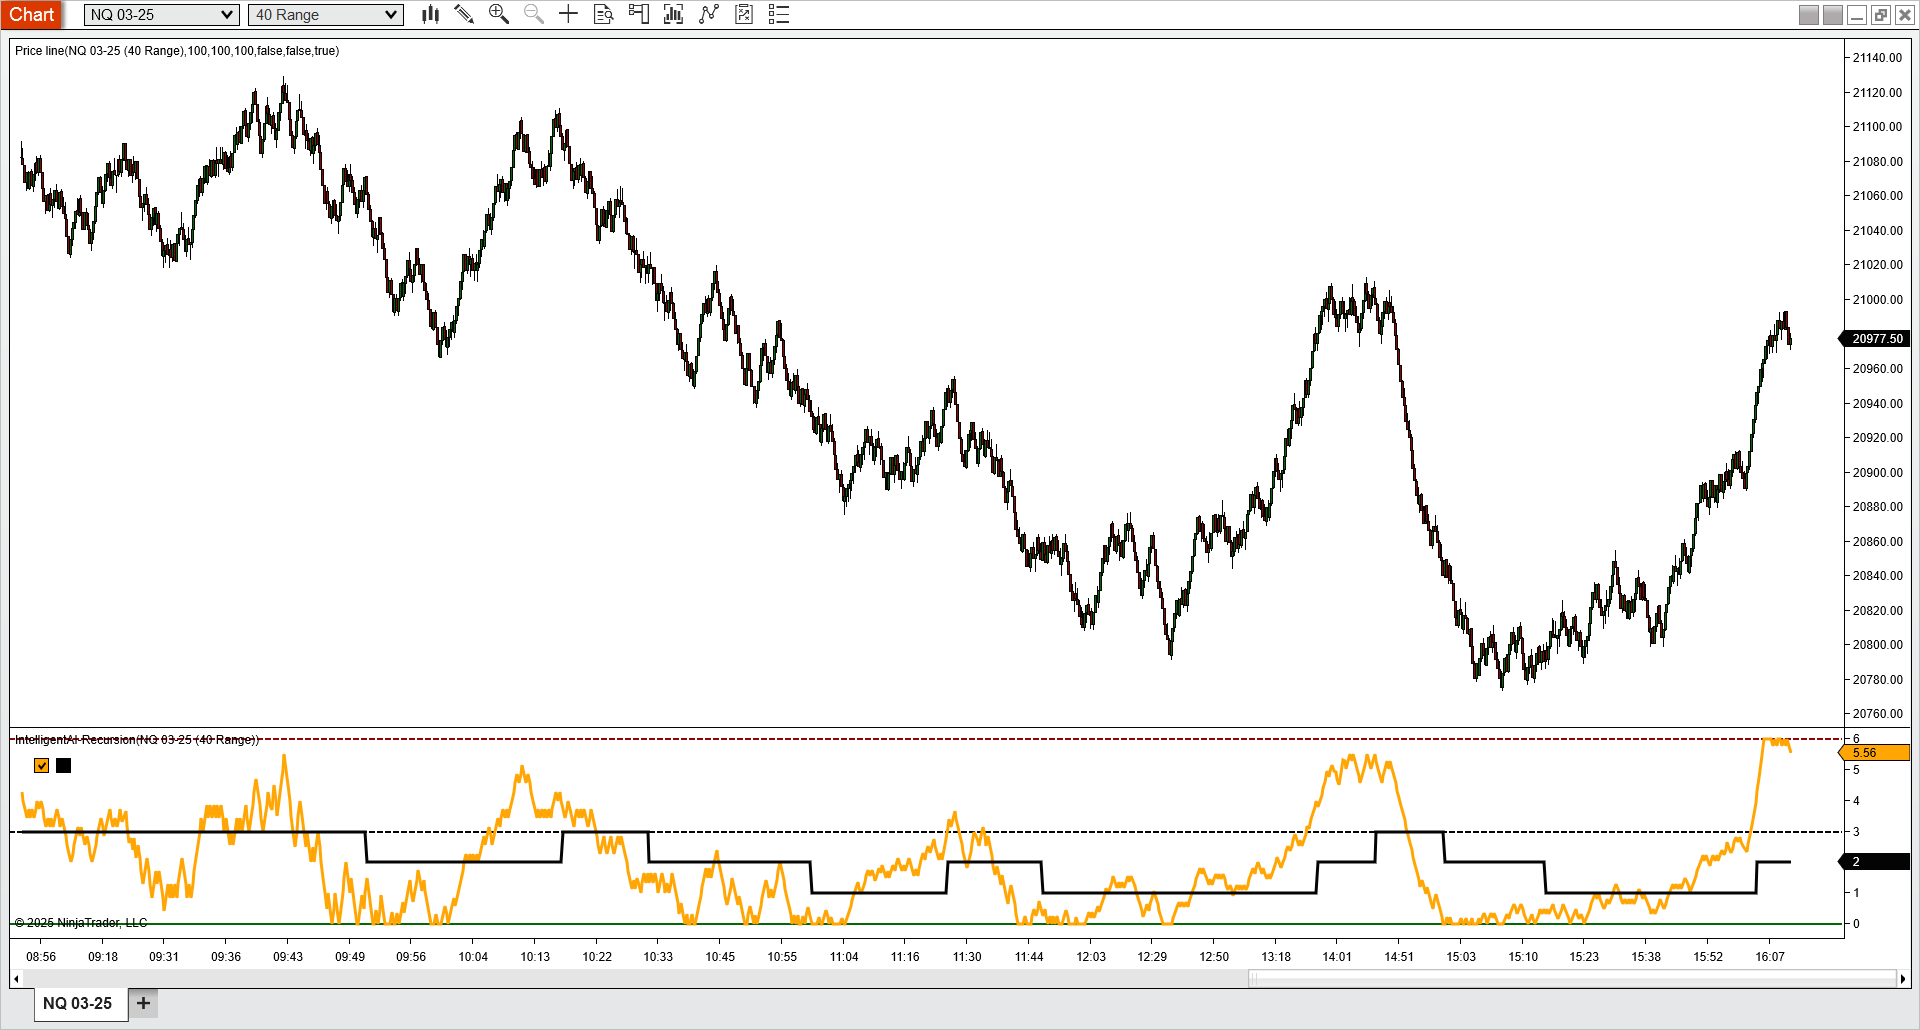
The NRM processes real-time ADM recursion data. Defying conventional advice, this model was trained using previously trained ADM and recursion data. This indicator utilizes two models. The first model generates a normalized plot of the trained recursion data, aiming to predict when a pivot or cycle reversal may occur. The second model provides a segmented plot of WAD model data to assess bias. Look for bullish setups when both NRM and WAD are at or near zero. Look for bearish setups when NRM and WAD are at or near six. Use past NRM/WAD crosses as a guide for future price alignment. On abnormal trending days (manipulation) only takes trades with the trend.
Usage: Two basic strategies
Observation Tip: When the recursion model has crossed above or below the black dashed line (3), look to the left to see where the last time recursion crossed. If the price at the current cross is less than the price at the previous cross consider a long trade to the previous cross price. If the price at the current cross is greater than the price at the previous cross consider a short trade to the previous cross price. See this chart.
Advanced Usage Tip: Add multiple ranges to your base chart and reference IntelligentAI-Recursion on each different range to see bullish and bearish MTF alignments. See this chart.
For your convenience, a premade template was copied to your charts template folder. On a chart with 3 data series, right click the chart and select Templates>Load and select IAI 3 Series AI-Recursion.
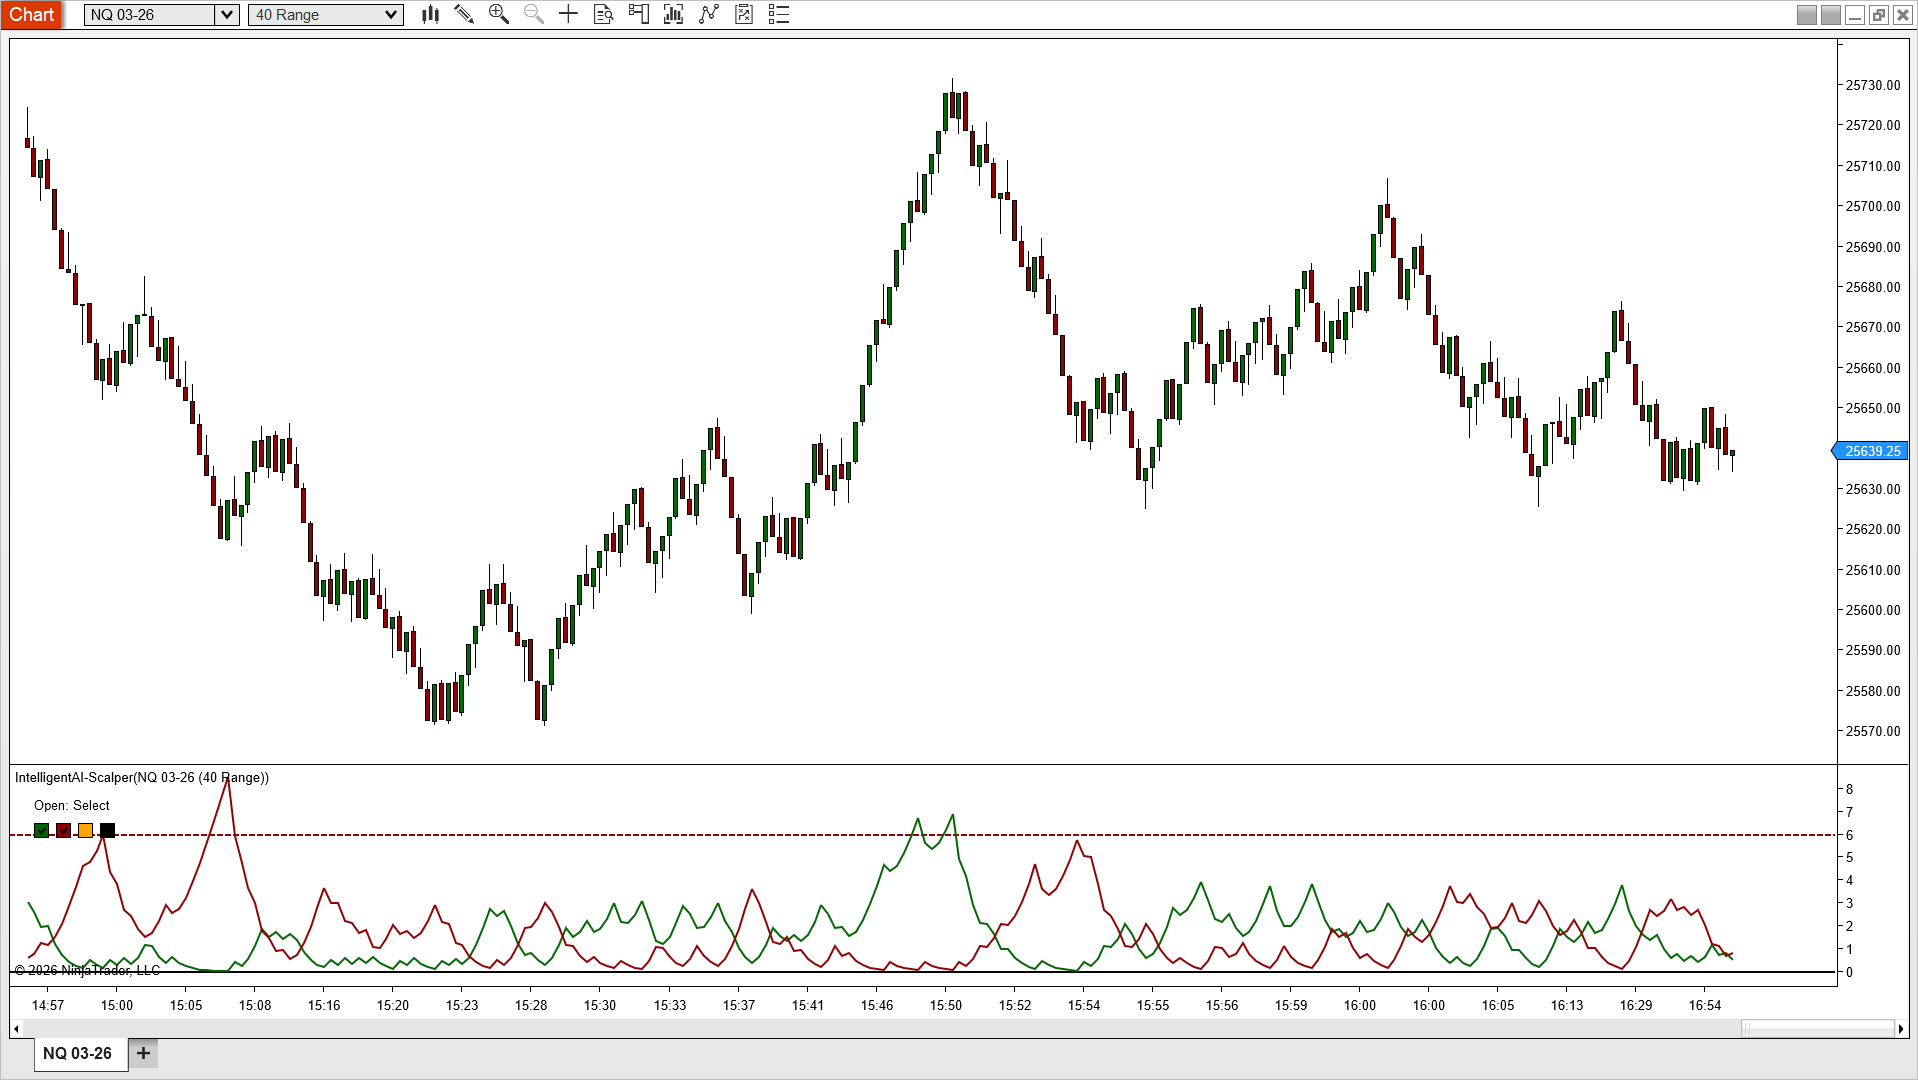
The CRM models processes real-time data from the ADM. The red plot indicates bearish reversals when at or near zero, while the green plot signals bullish reversals when at or near zero. Designed to capture the rhythms of price action, CRM enables precise scalping in and out of the legs of smaller cycles. CRM was designed for smaller faster scalping opportunities. Do not hold for extended periods. When volume is low switch to lower range charts. Consider using on a higher timeframe such as primary 8R and scalper using 20R.
Usage: Three basic strategies
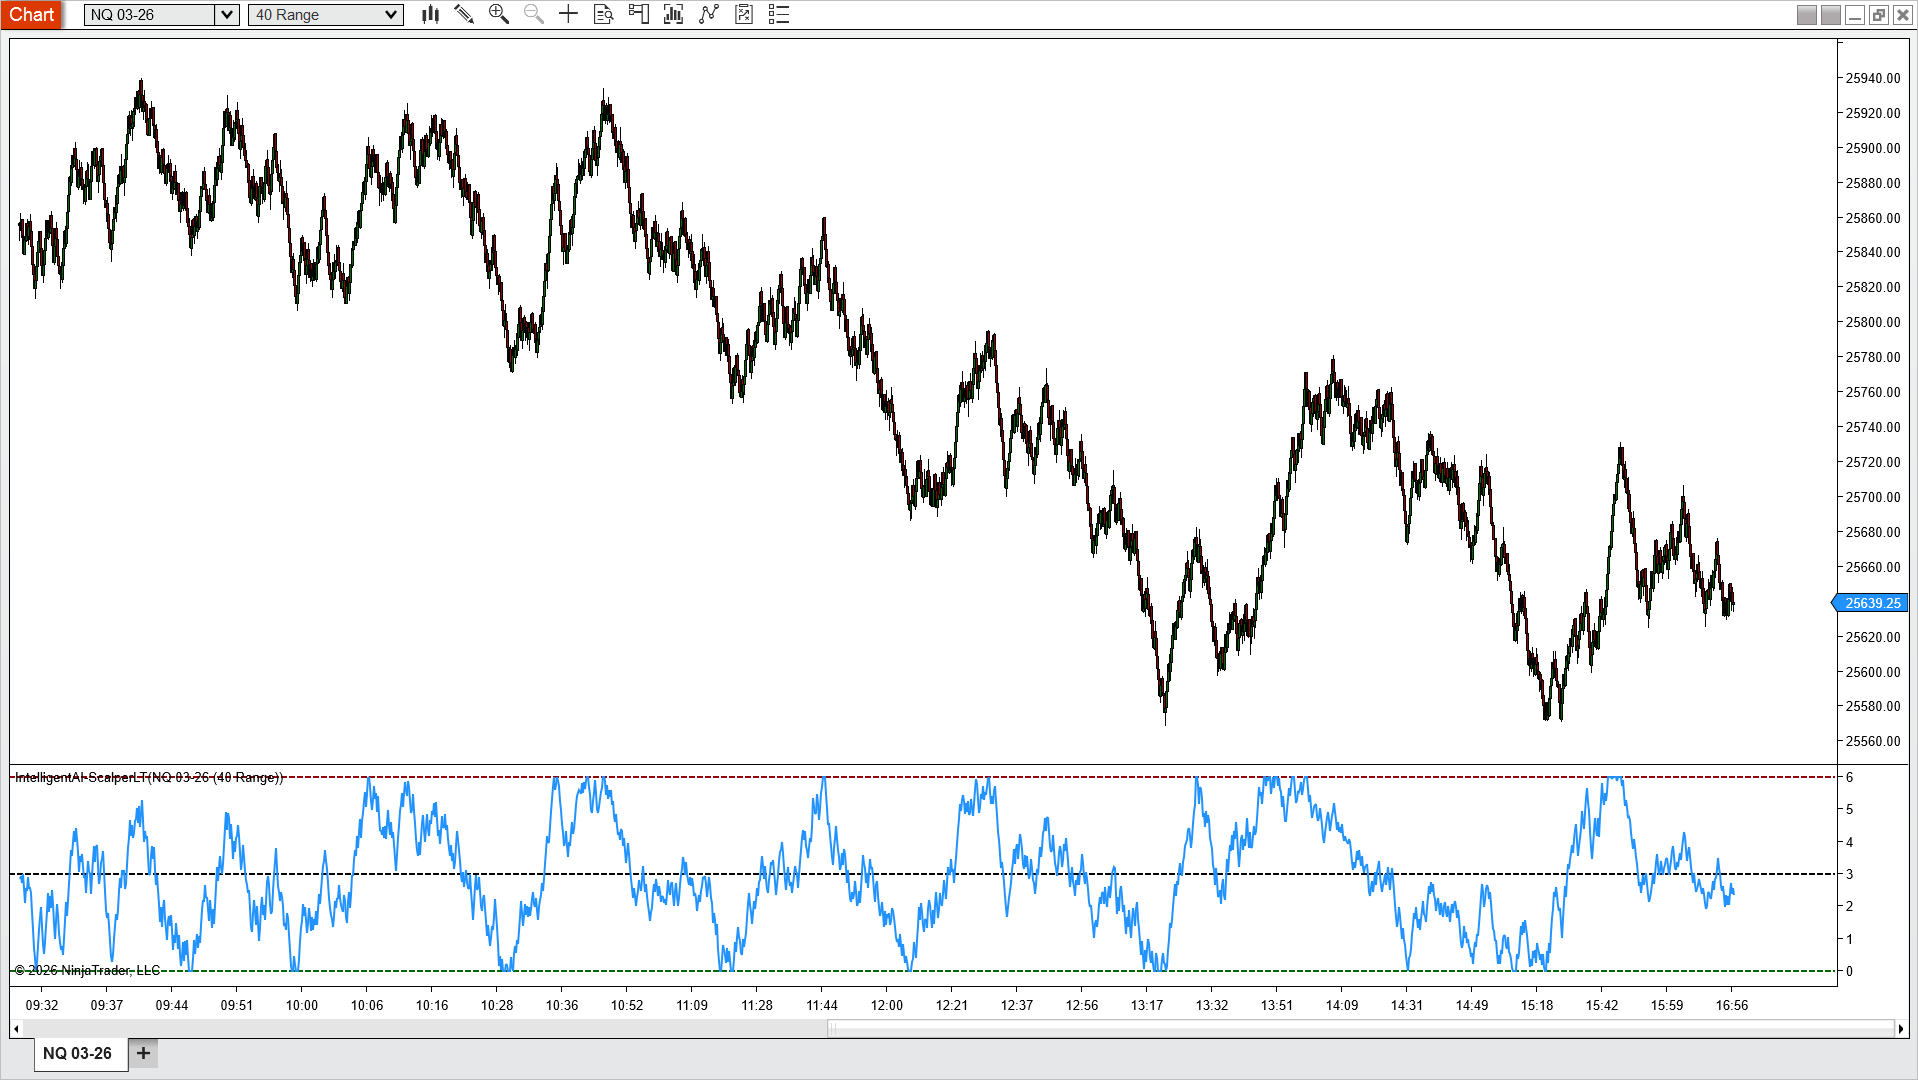
The CRMLT models processes real-time data from the ADM. This indicator is for larger cycle scalps. This model will oscillate back and forth between the green and red dashed lines. Unlike the AI-Lower, exact cycle completion should not be expected. Take profit often with short scalps. Designed to capture the rhythms of longer-term price action, CRMLT enables precise scalping in and out of larger cycles. On abnormal trending days only takes trades with the trend.
Usage: Two basic strategies
Advanced Usage Tip: Add higher ranges to your base chart and reference multiple AI-ScalperLT on each different range to see bullish and bearish MTF alignments. See Bullish chart. See Bearish chart.
For your convenience, a premade template was copied to your charts template folder. On a chart with 3 data series, right click the chart and select Templates>Load and select IAI 3 Series AI-ScalperLT.
Disclaimer
If you do not agree with any term or provision of this Disclaimer and our Terms and Conditions, you should not use our Site, Services, Content, Software or Information. Please be advised that your continued use of the Site, Services, Content, Software or Information provided shall indicate your consent and agreement to this Disclaimer and our Terms and Conditions.
DISCLAIMERS OF WARRANTIES AND LIMITATIONS ON LIABILITY. YOU AGREE THAT YOUR USE OF THE PRODUCT(S) AND THE CONTENT AVAILABLE THROUGH THE PURCHASE AND/OR SUBSCRIPTION ON THESE SITE(S) IS ON AN “AS-IS”, “AS AVAILABLE” BASIS AND WE AND OUR INFORMATION PROVIDERS SPECIFICALLY DISCLAIM ANY REPRESENTATIONS OR WARRANTIES, EXPRESS OR IMPLIED, INCLUDING, WITHOUT LIMITATION, ANY REPRESENTATIONS OR WARRANTIES INTERCHANGEABILITY OR FITNESS FOR A PARTICULAR PURPOSE. IN ADDITION, INTELLIGENT TRADER INC. MAKES NO REPRESENTATIONS OR WARRANTIES OF ANY KIND IN CONNECTION WITH THE SUBJECT MATTER INCLUDED ON OR THE USE OF THE SITE(S), AND USE OF THE SITE(S) IS SUBJECT TO THE DISCLAIMERS, TERMS AND CONDITIONS OF USE FOUND AT THE SITE(S).
Intelligent Trader Inc. is not registered as a securities broker-dealer or investment adviser with any jurisdiction and is not providing any personalized investment, financial or tax advice. Intelligent Trader Inc. cannot assess or guarantee the suitability of any particular investment to any personal situation. Accordingly, you bear complete responsibility for your own investment, financial and tax research and decisions and should seek the advice of a qualified professional prior to making any decisions based on your use of the product(s) and the content available through the purchase and/or subscription on these sites(s). The product(s) and the content are provided solely for informational purposes, and do not constitute an offer or solicitation to buy or sell any securities. All opinions expressed and information and data provided therein are subject to change without notice. We do not undertake any duty or obligation to update the product(s) or the content of the purchase and/or subscription to reflect current market conditions or other changes.
INTELLIGENT TRADER INC., ITS PARENT, INFORMATION PROVIDERS, AND THEIR RESPECTIVE SUBSIDIARIES, AFFILIATES, SHAREHOLDERS, DIRECTORS, OFFICERS, EMPLOYEES, SUBCONTRACTORS AND LICENSORS (THE“INTELLIGENT TRADER INC. PARTIES”) WILL NOT BE LIABLE (JOINTLY OR SEVERALLY) TO YOU OR ANY OTHER PERSON AS A RESULT OF YOUR ACCESS TO OR USE OF THE PRODUCT(S) AND THE CONTENT AVAILABLE THROUGH THE PURCHASE AND/OR SUBSCRIPTION ON THESE SITE(S) FOR INDIRECT, CONSEQUENTIAL, SPECIAL, INCIDENTAL, PUNITIVE, OR EXEMPLARY DAMAGES, INCLUDING, BUT WITHOUT LIMITATION TO, LOST PROFITS, LOST SAVINGS AND LOST REVENUES (COLLECTIVELY, THE “EXCLUDED DAMAGES”), WHETHER OR NOT CHARACTERIZED IN NEGLIGENCE, TORT, CONTRACT, OR OTHER THEORY OF LIABILITY, EVEN IF ANY OF THE INTELLIGENT TRADER INC. PARTIES HAVE BEEN ADVISED OF THE POSSIBILITY OF OR COULD HAVE FORESEEN ANY OF THE EXCLUDED DAMAGES, AND IRRESPECTIVE OF ANY FAILURE OF AN ESSENTIAL PURPOSE OF A LIMITED REMEDY. IF ANY APPLICABLE AUTHORITY HOLDS ANY PORTION OF THIS SECTION TO BE UNENFORCEABLE, THEN THE INTELLIGENT TRADER INC. PARTIES’ LIABILITY WILL BE LIMITED TO THE FULLEST POSSIBLE EXTENT PERMITTED BY APPLICABLE LAW.
IN NO EVENT WILL INTELLIGENT TRADER INC. OR ANY OF THE INTELLIGENT TRADER INC. PARTIES BE LIABLE FOR ANY DAMAGES OR LOSSES RESULTING FROM ANY INVESTMENT, FINANCIAL OR TAX DECISIONS YOU MAKE AS A RESULT OF ACCESSING OR USING THE PRODUCT(S) AND THE CONTENT AVAILABLE THROUGH THE PURCHASE AND/OR SUBSCRIPTION ON THESE SITE(S).
By using these Site(s) and accessing or using the product(s) and content available through purchase and/or subscription on these Site(s), you accept the foregoing disclaimers and limitations on liability and you assume all risks associated with such use (including but without limitation to, risk of investment losses, risk to your computer, software or data being damaged by any infections or viruses, worms, Trojan horses or other code that manifest contaminating or destructive properties transmitted or activated via the purchase and/or subscription or material that may be included within or accessed from the purchase and/or subscription).
Partners: We are not responsible for the actions of our partners or others who may choose to advertise this Site(s) and/or its products/services. All our affiliates must remember that they have agreed to these same Disclaimer and Terms and Conditions which outlines the rules and regulations they have agreed to follow.
Partners may not under any circumstances send out unsolicited mailings (spam) of any sort.
CFTC – U.S. Government Required Disclaimer: Forex, futures and options trading have large potential rewards, but also large potential risk. You must be aware of the risks and be willing to accept them in order to invest in the forex, futures and options markets. Don’t trade with money you can’t afford to lose. Our website, product contents, and materials are neither a solicitation nor an offer to Buy/Sell currencies, futures or options. No representation is being made that any account will or is likely to achieve profits or losses similar to those discussed on our website or in any of our materials. The past performance of any trading system or methodology is not necessarily indicative of future results. Substantial risk is involved. Forex trading has large potential rewards, but also large potential risk. You must beware of the risks and be willing to accept them in order to invest in the Forex markets.
CFTC RULE 4.41 – HYPOTHETICAL OR SIMULATED PERFORMANCE RESULTS HAVE CERTAIN LIMITATIONS. UNLIKE AN ACTUAL PERFORMANCE RECORD, SIMULATED RESULTS DO NOT REPRESENT ACTUAL TRADING. ALSO, SINCE THE TRADES HAVE NOT BEEN EXECUTED, THE RESULTS MAY HAVE UNDER-OR-OVER COMPENSATED FOR THE IMPACT, IF ANY, OF CERTAIN MARKET FACTORS, SUCH AS LACK OF LIQUIDITY. SIMULATED TRADING PROGRAMS IN GENERAL ARE ALSO SUBJECT TO THE FACT THAT THEY ARE DESIGNED WITH THE BENEFIT OF HINDSIGHT. NO REPRESENTATION IS BEING MADE THAN ANY ACCOUNT WILL OR IS LIKELY TO ACHIEVE PROFIT OR LOSSES SIMILAR TO THOSE SHOWN.
NFA and CTFC Required Disclaimers: Trading in the Foreign Exchange market is a challenging opportunity where above average returns are available for educated and experienced investors who are willing to take above average risk. However, before deciding to participate in Foreign Exchange (FX) trading, you should carefully consider your investment objectives, level of experience and risk appetite. Do not invest money you cannot afford to lose.
INVESTORS ACKNOWLEDGE AND AGREE THAT ANY INVESTMENT IN FINANCIAL INSTRUMENTS IS OF A RANDOM NATURE AND, THEREFORE, ANY SUCH INVESTMENT CONSTITUTES A RISKY INVESTMENT THAT IS THE SOLE RESPONSIBILITY OF THE INVESTOR. DUE TO THE HIGH-RISK NATURE OF TRADING, INTELLIGENT TRADER INC. EXPLICITLY DOES NOT MAKE ANY EXPRESS OR IMPLIED WARRANTIES OR GUARANTEES THAT USERS WILL MAKE ANY PROFIT OR THAT USERS WILL NOT LOSE ANY OR ALL DEPOSITED INVESTMENT FUNDS.
Forex products are intended for investors with specific knowledge, aware that the risk of loss can be up to the total amount invested or even exceed the initial investment. Before making any investment decision, investors should contact their financial adviser to verify the suitability of the investment.
All information found on the intelligenttraderinc.com website and email newsletters (past, present, and future) exists for nothing other than general informational purposes. Any financial numbers referenced on this site or on any of our other sites or emails, are simply estimates or projections or past results, and should not be considered exact, actual or as a promise of potential earnings – all numbers are for illustrative and educational purposes only.
It is specified that the past performance of a financial product does not prejudge in any way its future performance. It follows from the foregoing that Intelligent Trader Inc.’s liability cannot be held directly or indirectly, particularly in the event of a financial loss, regardless of its amount.